


Info
Description Of Tests
On this page we list a brief description of each test performed.
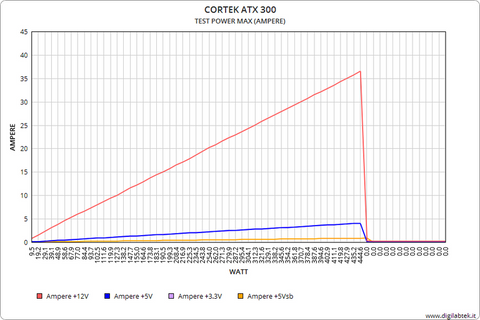
Power Max Amps
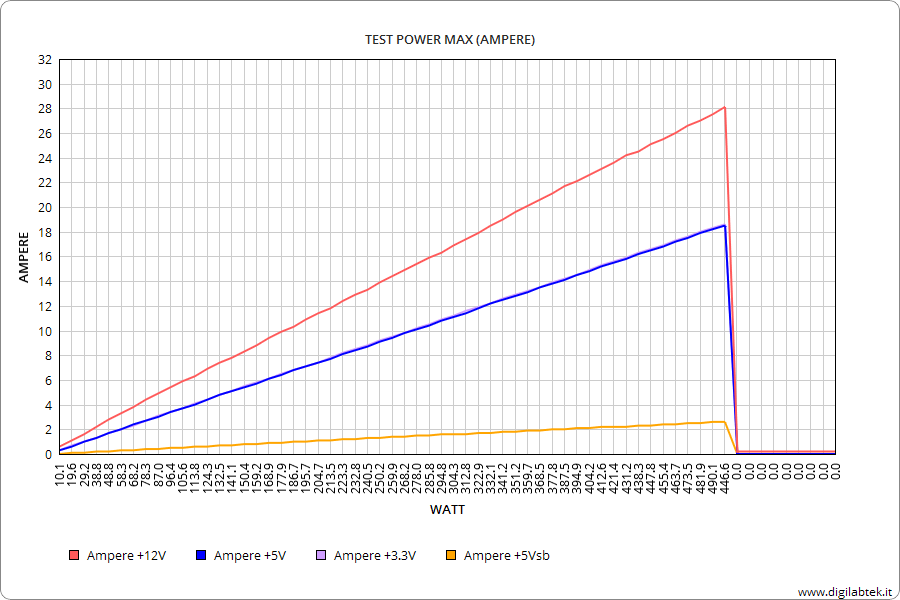
The first test is of extreme type based on the measurement of peak maximum currents, the Load load is set on the Rail + 12V + 5V + 3.3V and + 5Vsb over the declared values, in the graph in the vertical axis the currents are reported measured instantly for each Rail, while on the horizontal axis the maximum power output is shown, this test shows us the maximum current delivered and therefore if the powers are real, lower or higher than those declared. This test is very important in the overall evaluation of the power supply.
power Max Amps
Power Max Ampere +12V
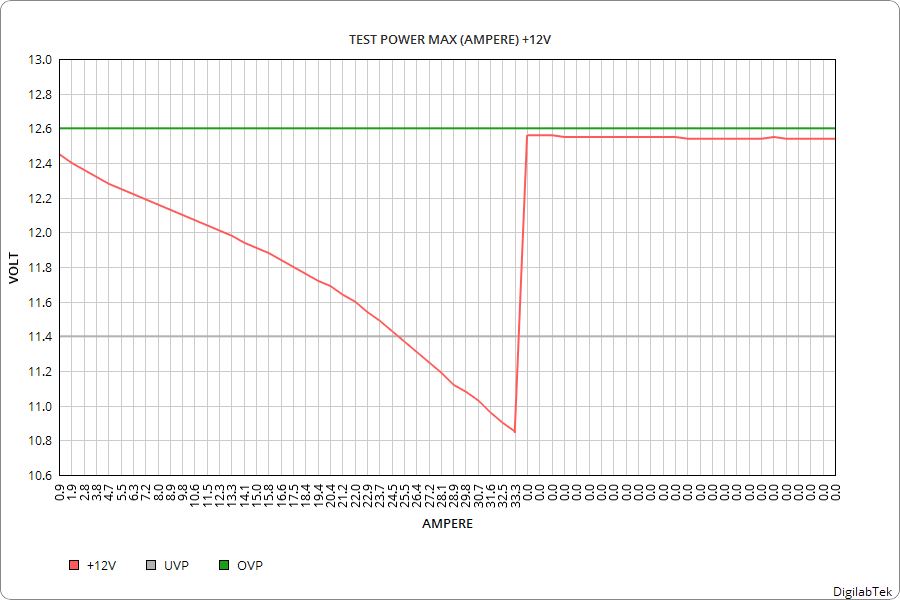
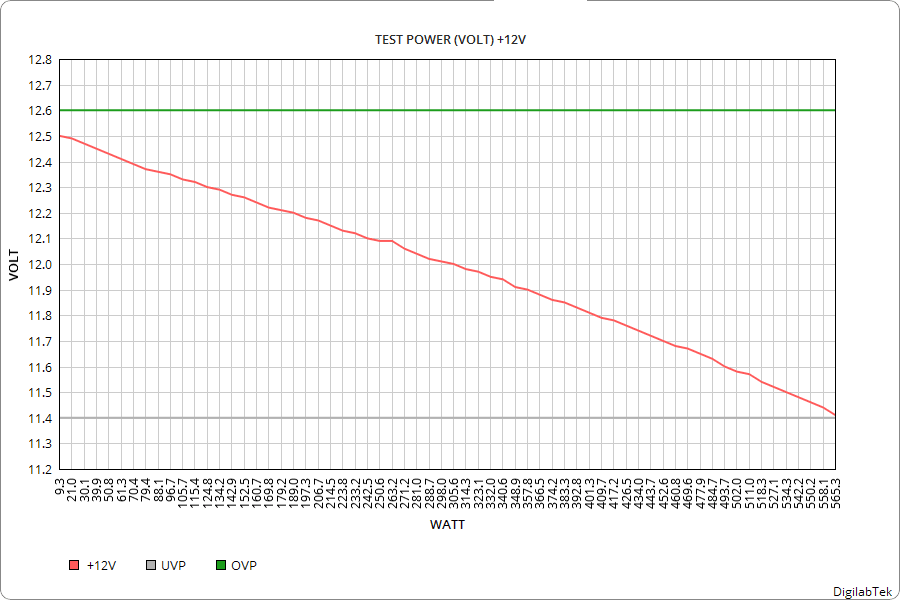
Also this test is of extreme type based on the measurement of the maximum peak current on the single Rail + 12V, it sets the Load load over the declared values and pushes the power supply progressively beyond these limits until it goes off entering OverCurrent Protection , in the graph in the vertical axis are reported the variations of voltages measured instantly, while on the horizontal axis are reported the values of Ampere in Load, this test shows us the maximum currents supplied and therefore if the powers are different from those declared. The UVP and OVP values indicate the minimum and maximum voltage limits accepted for correct operation.
Power Max Ampere +5V
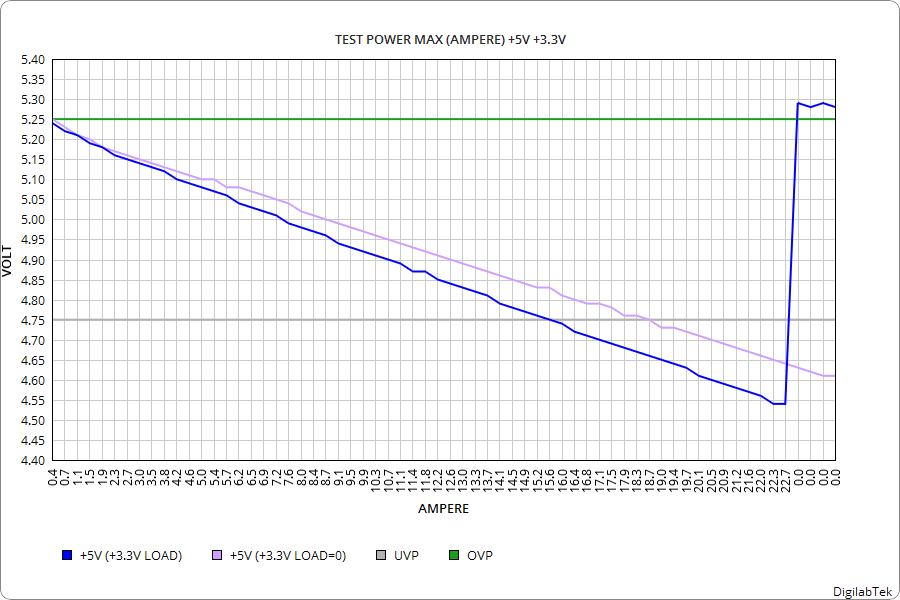
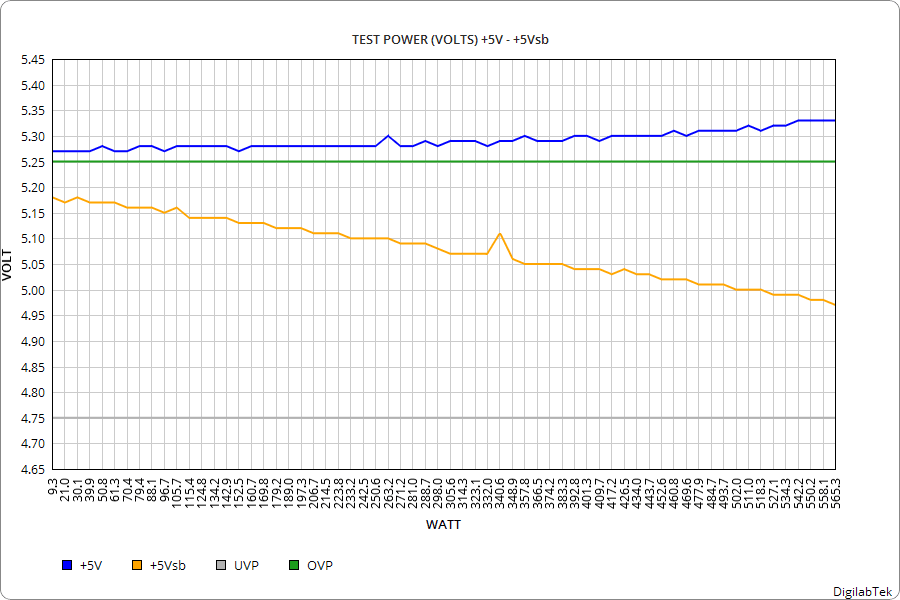
Also this test is of extreme type based on the measurement of the peak peak current on the single Rail + 5V and subsequently together with the Rail + 3.3V, it sets the Load load over the declared values and pushes the power supply progressively beyond these limits until when it goes off when entering OverCurrent Protection the operation is repeated together with a progressive load on the Rail + 3.3V, in the graph in the vertical axis are reported the variations of voltages measured instantly in both passages, while on the horizontal axis are reported the values of Ampere in Load, this test shows us the maximum currents delivered in both tests and therefore if the powers are different from those declared. The UVP and OVP values indicate the minimum and maximum voltage limits accepted for correct operation.
Power Max Ampere +3.3V
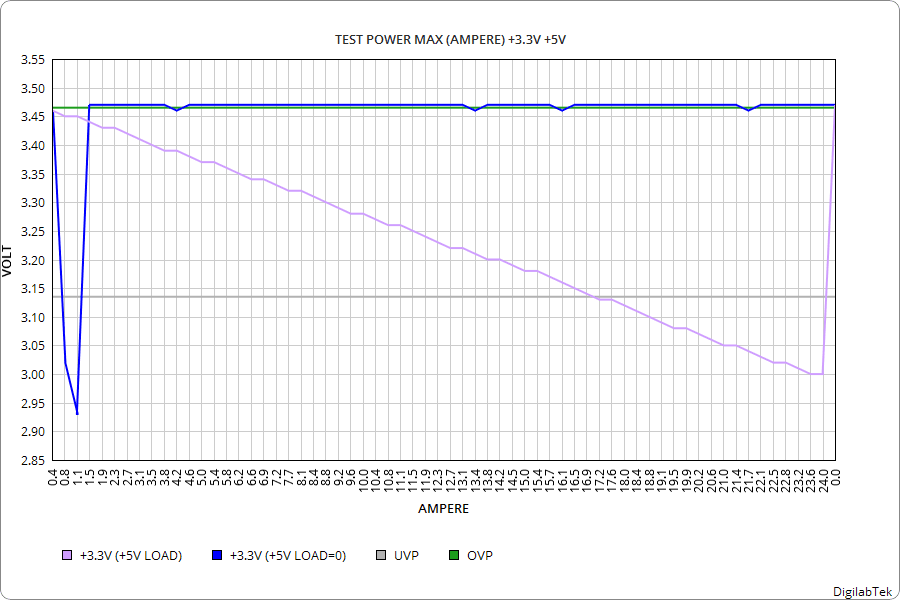
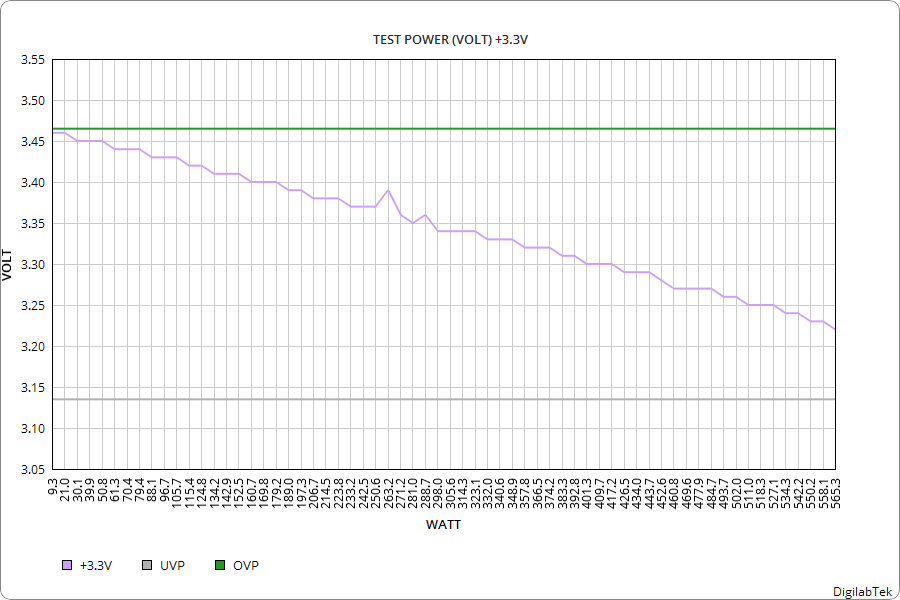
Also this test is of extreme type based on the measurement of the peak peak current on the single Rail + 3.3V and subsequently together with the Rail + 5V, it sets the Load load over the declared values and pushes the power supply progressively beyond these limits until when it goes off when entering OverCurrent Protection the operation is repeated together with a progressive load on the Rail + 5V, in the graph in the vertical axis are reported the variations of voltages measured instantly in both passages, while on the horizontal axis are reported the Ampere in Load values, this test shows us the maximum currents delivered in both tests and therefore if the powers are different from those declared. The UVP and OVP values indicate the minimum and maximum voltage limits accepted for correct operation.
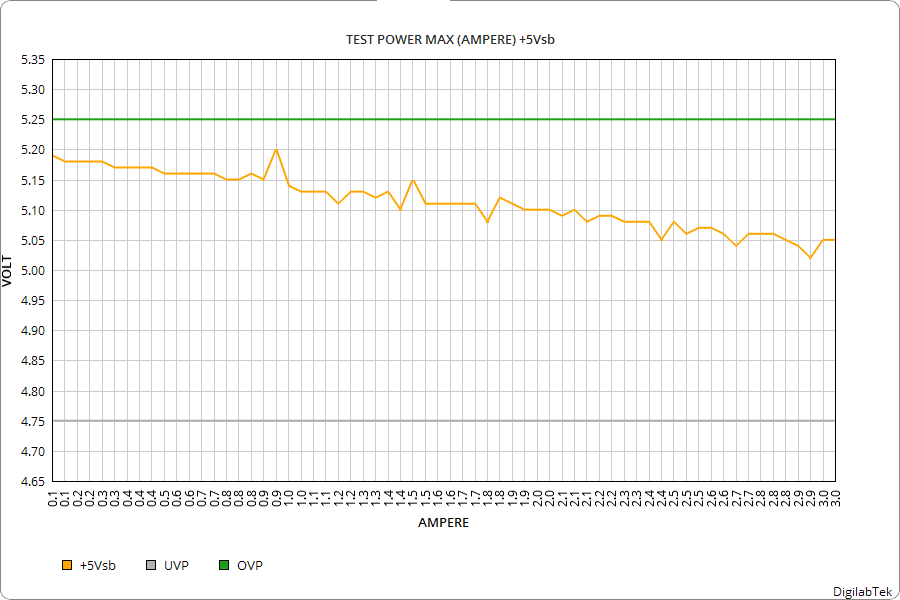
Power Max Ampere +5Vsb
Power (Voltage 12V)
Power (Voltage 5V + 5Vsb)
Power (Voltage 3.3 V)
Spike Noise (Voltage Pk-Pk)
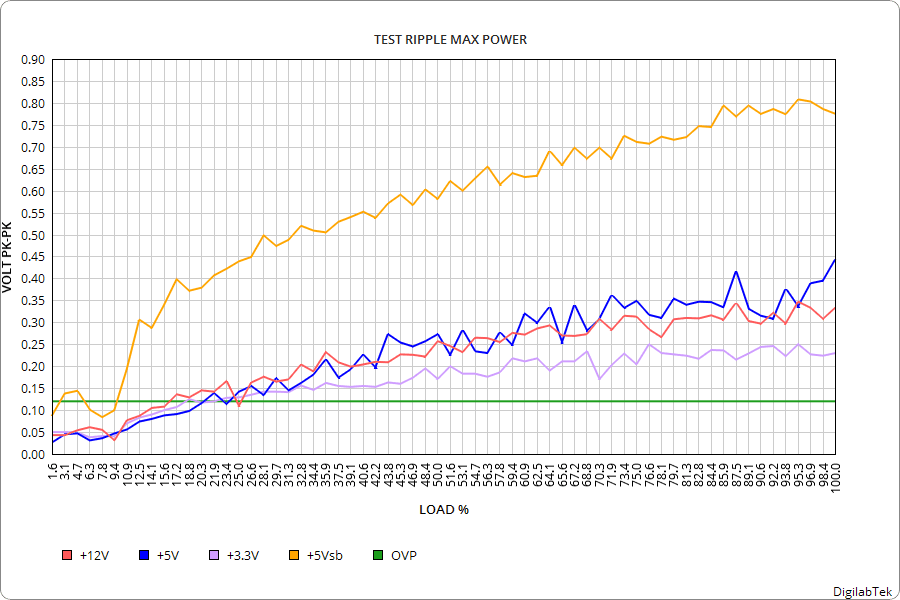
This test indicates the Spike level at the same time on each single Rail, specifically the + 12V + 5V + 3.3V + 5Vsb, the measurements are carried out with Peak-Peak mode simultaneously with the progressive increase of the absorbed power. The value of OVP indicates the Ripple value that would be indicated not to exceed. In the graph in the vertical axis are reported Spike voltages measured instantly for each Rail, while on the horizontal axis is reported the maximum power output, this test shows us the quality of disturbances present on the voltage in relation to power.
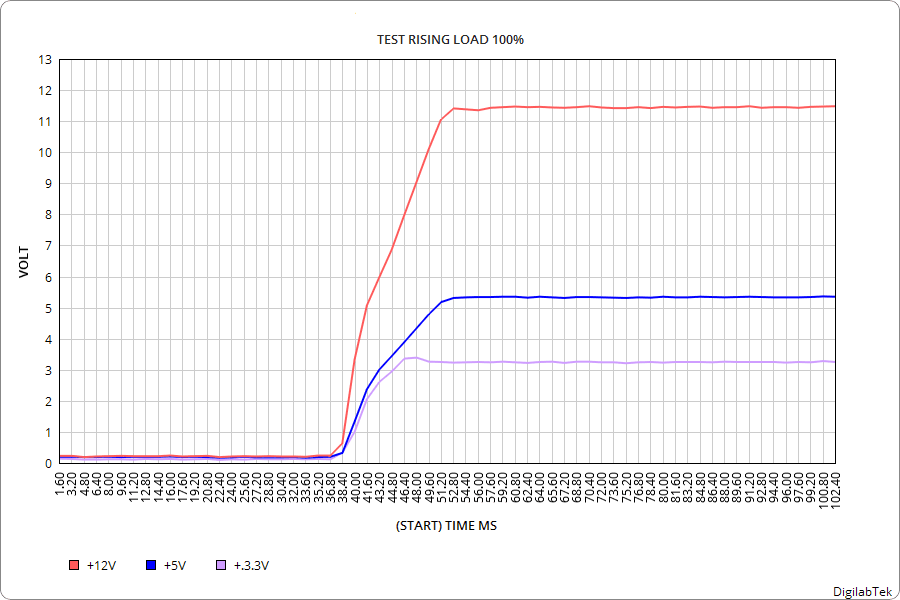
Rising (Voltage)
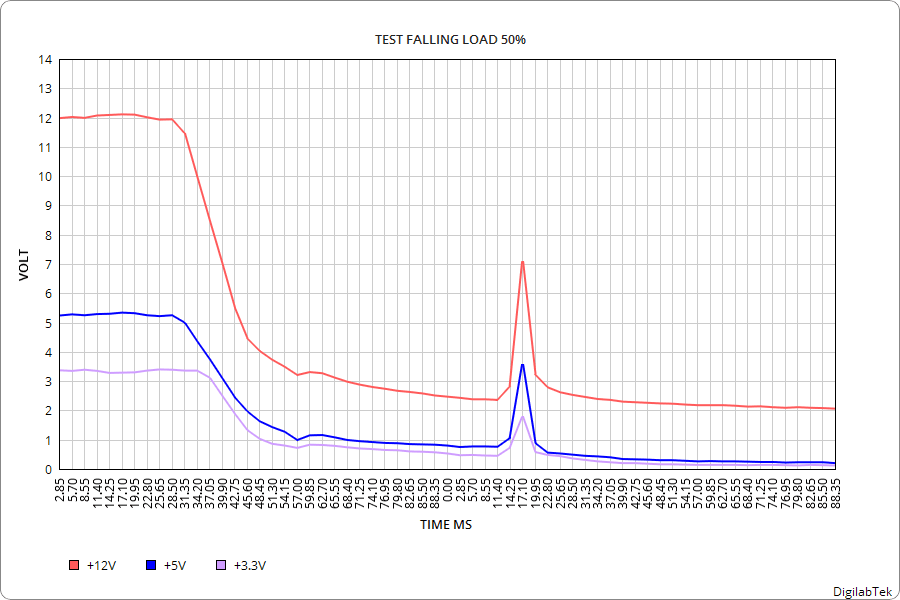
Falling (Voltage)
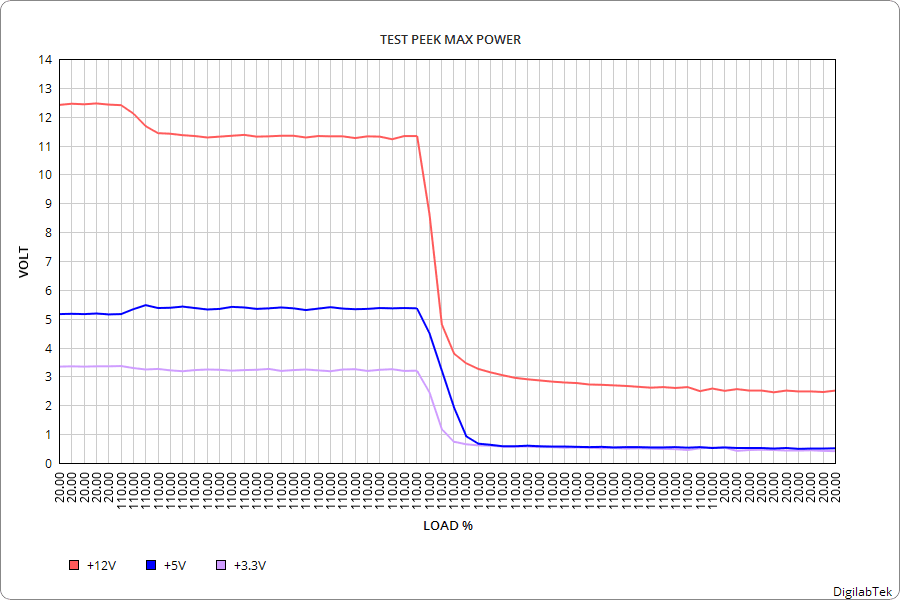
Peek (Voltage)
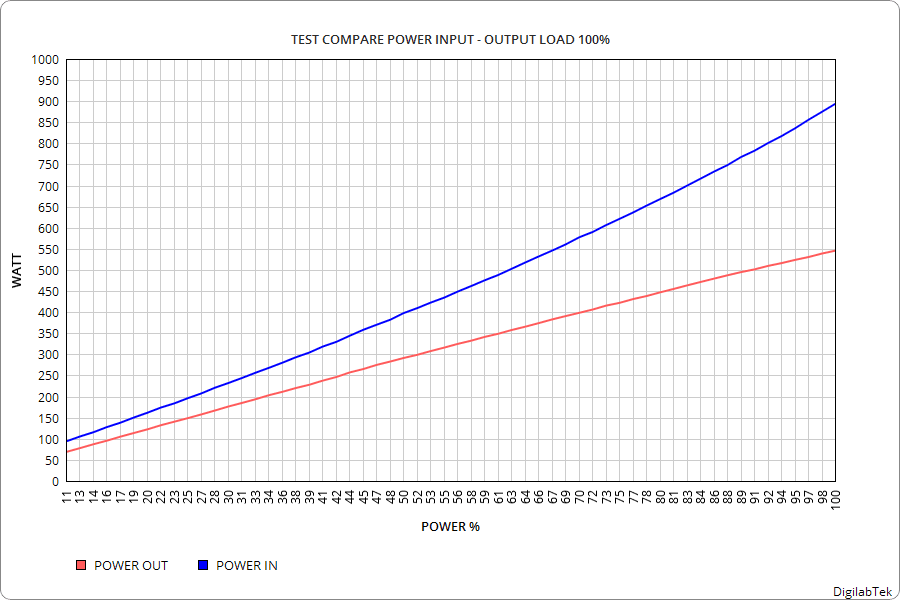
Compare Input and Output Power
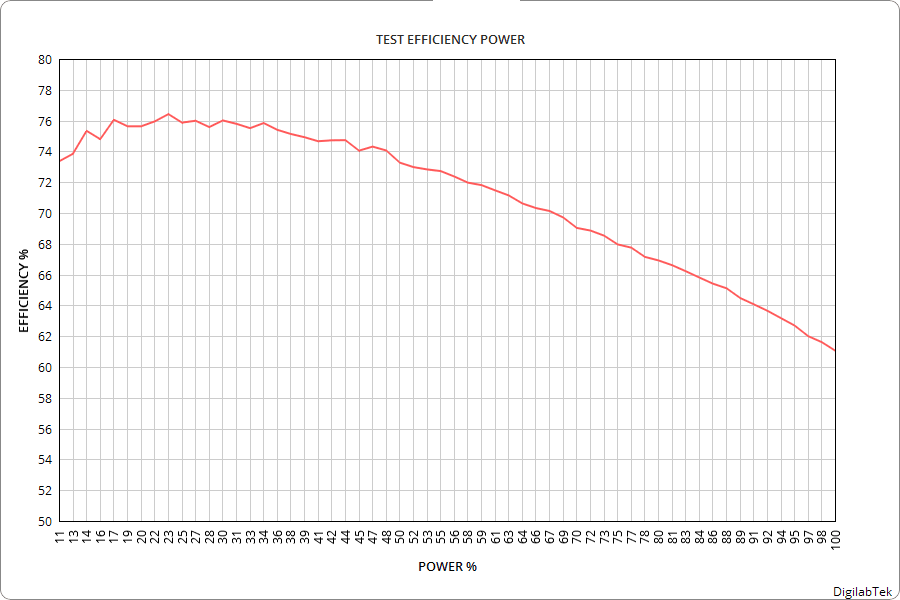
Efficiency Power Supply
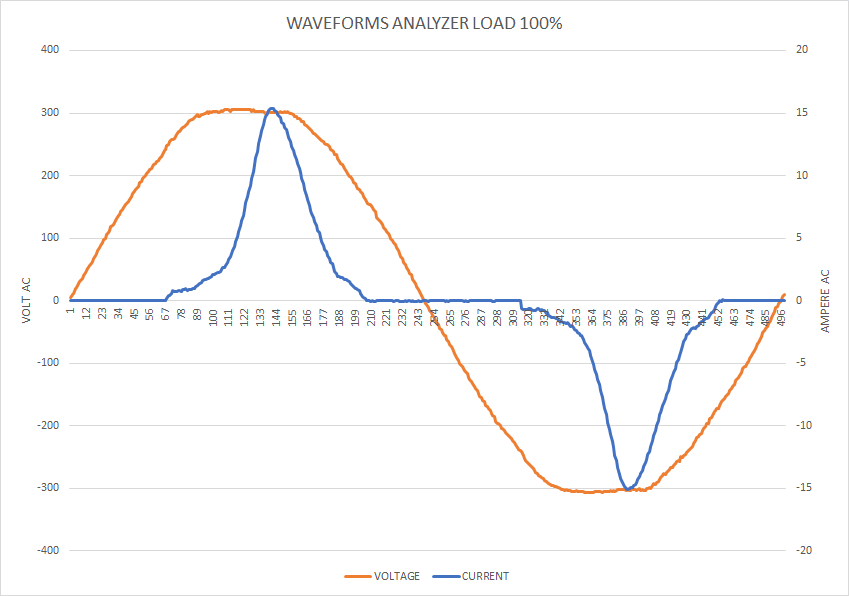
Compare Current and Voltage Waveforms